Google Shopping started in 2002, (Froogle) with the goal of providing a user-friendly comparison shopping service for everyone. At this time, listing products were free to do, but you had to pay for sponsored links.
As we all know, this gained huge popularity amongst both buyers and sellers. On the one hand, it provided a collection of brands in the same place for the same products for buyers, so that they easily could find the best deal. And it allowed sellers to gain traffic and new potential shoppers. And this resulted in an integration between Froogle and Google Ads, in 2007. And ultimately, it started to be a paid service in 2012 and Google started calling it: Google Shopping. And merchants had to start paying to display their products.
And today it's a serious e-commerce platform used globally with fierce competition.
With this in mind, the first question we ask our customers is:
Do you know which products are performing well on your Google Shopping campaigns?
... and follow up with :
Do you know why are they performing well?
What we found was that many of our customers believe they know how they are performing, on which products they are earning the most ROAS and where the money is going.
However, we created a new analysis and so far, only one of our stores has proved itself right.
Are you missing out on untapped potential?
First, we take a look at How many of your products are getting clicks, and how many of them are reaching your average ROAS?
In the case below, the store is not buying clicks on a whopping 52% of their feed, and to make matters worse, they are only profitable (according to their ROAS targets) on 6% of their products! And this is not the worst we have seen.
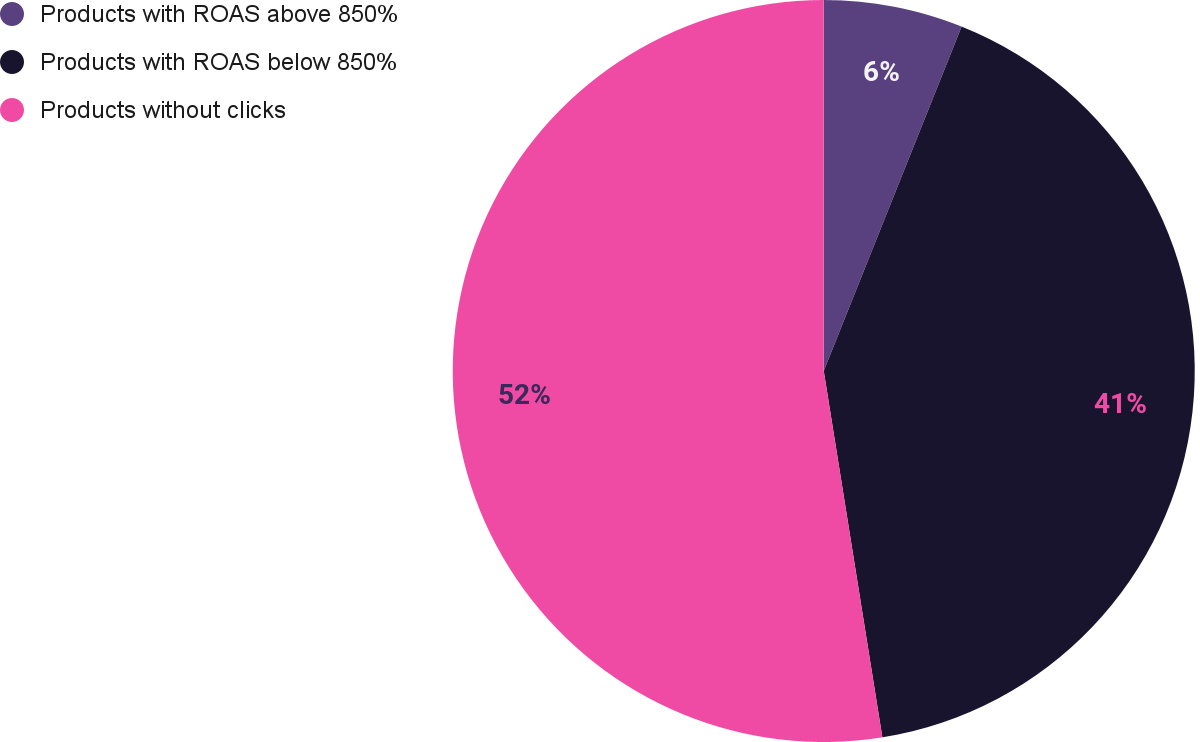
One customers’ product performance using Google Smart Shopping
We have noticed that, if you either use manual bidding or SMART shopping, you are missing out on potential revenue. Many stores that are using manual bidding don't have the time to activate all their products, which means that they are focusing on their best sellers and they are letting the rest of their inventory rest.
We have also seen the same ‘’best sellers’’ pattern in a lot of SMART shopping cases. Where a big chunk of the inventory is not getting the attention it needs.
Bidbrain uses a way of clustering that helps our stores activate more products. In one case where the store used manual bidding before Bidbrain, focusing only on best sellers. Bidbrain then match similar products together and managed to activate a lot more products which increased their conversion value by over 400%.
Read more about the case here.
Where is your money going?
The next thing we look at is your budget allocation.
Where are you spending your money: Is it on good products or on bad products?
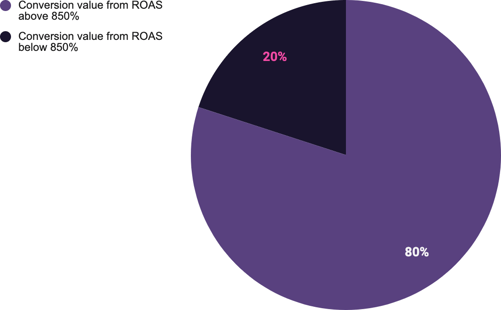
In this case, we see that 73% of this store's budget is being spent on products performing below their target ROAS. And these products are only generating 20% of the total conversion value.
Surely there is some improvement to do here.
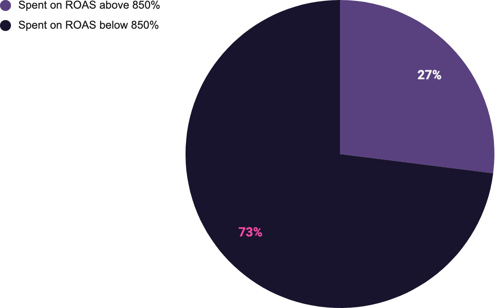
80% of the conversion value is coming from 27% of the budget and only 6% of the products.
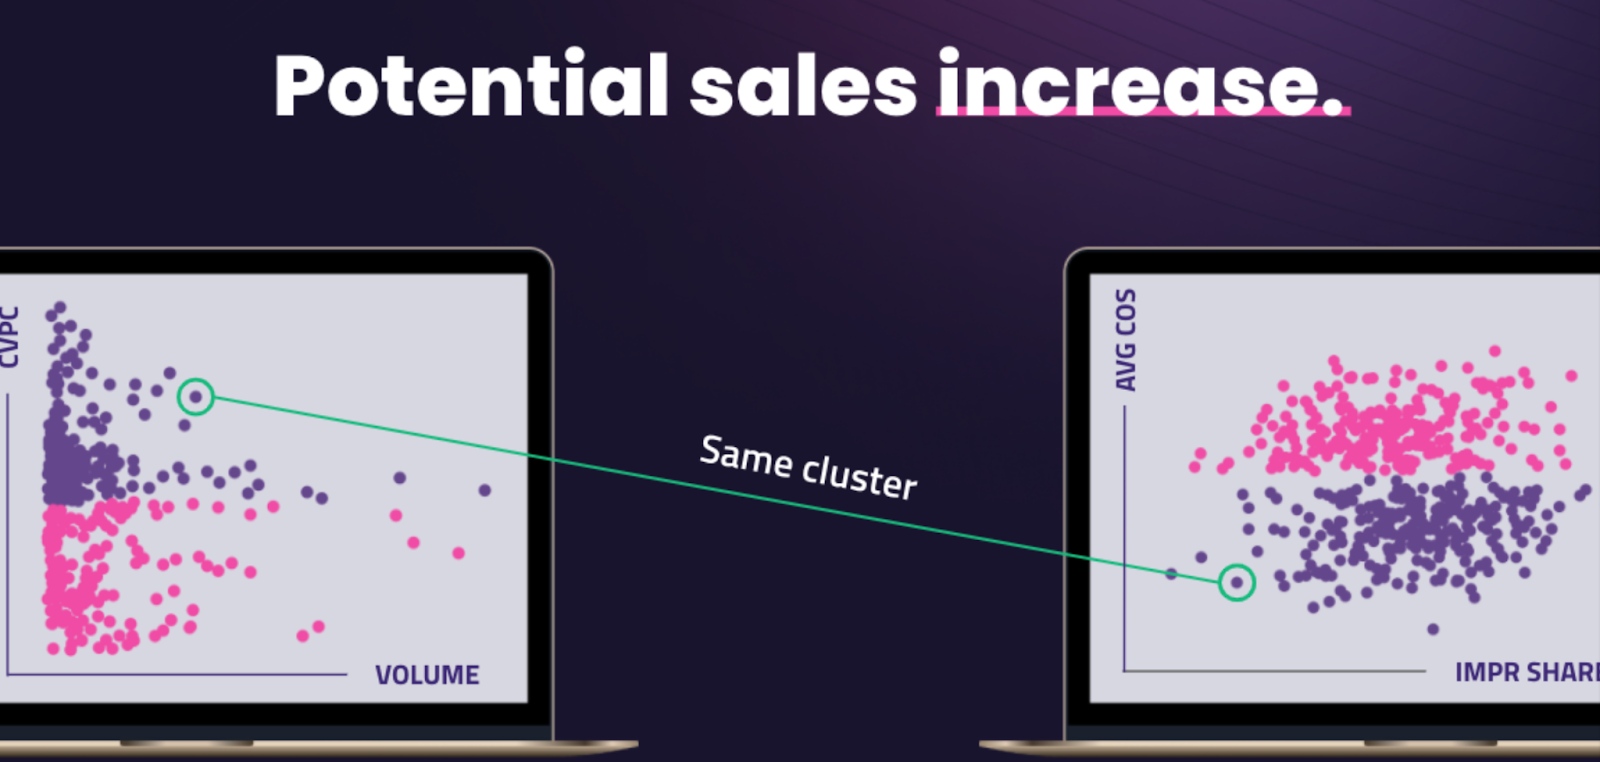
Our AI is great at spotting potential and waste. For example, if Bidbrain find a good cluster, it also looks at the impressions share.
If the cluster has low impressions share but high Conversion value per click value it will increase the budget.
The same goes for bad clusters.
If Bidbrain finds a bad cluster, and sees that it has a high impression share it will decrease the spend on that cluster and move it to the good one.
Are you optimizing your feed?
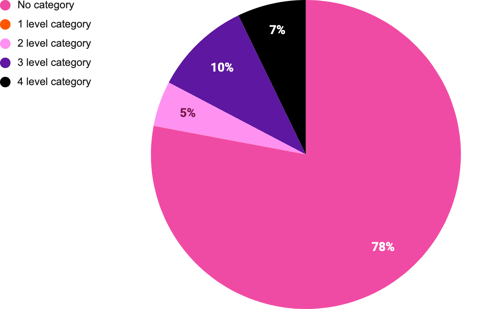
Now that we know where the money is spent, we look at product feed and the category levels.
In this case, 78% of this store's products don't even have a category.
And, Google has crawled 2-5 levels for them:
Levels of Google Categories in this product feed:
If we then break it down to: Where is the conversion value coming from? We can see the enormous value of category levels.
Even though only 7% of this store's products have 4 category levels, they stand for 25% of the total conversion value generated!
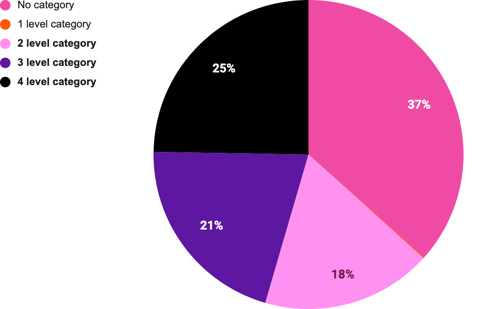
If you have ever looked for a sign to work with your Google_category and product_type levels: Now is the time!
This is some of the data we look at in our new analysis, if you wish to know. Let us help you!
Want to know how your Google Shopping campaigns are really performing?
Signup to a free Bidbrain account and create your own bid analysis to find out how your Google Shopping ads are performing.